- Wachter Space Blog about Security and Automated Methods/
- Posts/
- Large Scale Empirical Ethereum Smart Contract Analysis/
Large Scale Empirical Ethereum Smart Contract Analysis
Ethereum smart contracts are Turing complete programs that operate on money and derived assets. With a market capitalization in the three digit billions, there is an interest in quantifying their usage. Despite blockchain data being public by design, large scale analysis of smart contracts is technically challenging to do on a large scale. We summarize methods to analyze contract usage on the Ethereum blockchain and categorize the most popular contracts by their application domain and behavior. Especially, changes in behavior before and after removing gas refunds on the Ethereum blockchain are analyzed. Furthermore, we quantify the adoption of final Ethereum Requests for Comments (ERCs), that standardize smart contracts for certain applications. According to the used metrics, trading related smart contracts, are the most popular. In that context, we explain, why using just a single metric can be misleading. The removal of gas refunds lead to significant changes in contract lifetime and state cleanup.
Ethereum, Smart Contracts, EVM Bytecode, Data Analysis
Introduction
Smart contracts on the Ethereum blockchain operate on blockchain state, meaning that they can send, receive and own Ether (ETH), Ethereums native currency. They can also call other smart contracts, which enables them in particular to operate on derived assets, such as tokens. Smart contracts may stand alone, or be part of a larger application, by interacting with other smart contracts and externally owned addresses. The behavior of smart contracts is entirely defined by their code and cannot be controlled or manipulated beyond the public, immutable implementation.
There are vast promises regarding the benefits and various applications of smart contracts on the Ethereum blockchain. Among them is especially interoperability between platforms, in contrast to current platforms in web2. A prerequisite for interoperability is standardization of common applications. The introduction of standards and changes to layer have impact on where the Ethereum ecosystem is moving. With a market capitalization in the three digit billions of dollars, it is interesting to look at what categories of smart contracts are currently used the most, what impacts do layer one changes have on the usage of smart contracts and what standards currently exist for smart contracts how widely they are adopted.
Even though being public by design, the linear blockchain data, with all kinds of transactions mixed together and only minimally data recorded, does not lend itself very well to the large scale analysis of smart contracts. For analysis, multiple terabytes of data must be organized in a way that allows useful queries, for example in a relational database. Besides the technical challenges, there are also theoretical boundaries of analyzing smart contracts. Rice’s theorem states, that no trivial property of an arbitrary program can be algorithmically decided (Rice 1953). This includes semantic equality. Therefore, this work looks at identifying common or standardized smart contracts.
The contribution of this work is summarizing methods for smart contract analysis from the literature and expanding current literature by comparing them to online query services, that are mostly used for this work, cf. 4 Especially, the methods are used to quantify the usage of the most popular smart contract, smart contracts, until 30. August 2022. This is done by looking at the most popular smart contracts, according to different metrics, and categorizing them, partly reproducing and updating previous work (Angelo and Salzer 2020; Di Angelo and Salzer 2019), as well as looking at newer trends. As metrics, first the number of deployments is used, because it informs the state usage and performance of the blockchain, cf. 2. Furthermore, we also look at the smart contracts with the most calls and alternatively the smart contracts with the highest gas usage, as it more reflects what users are willing to pay for being executed. The research question of current smart contract usage is also approached by quantifying the adoption of ERCs, cf. 6.
Background
In this section, we describe aspects that are particularly relevant for this work and define terminology.
Smart Contracts
There are two types of participants on the Ethereum blockchain – externally owned accounts and smart contracts. Both can send and receive Ether. However, there only exist private keys for externally owned accounts. The behavior of smart contracts is entirely defined by their code. Smart contracts can be deployed by externally owned accounts or other smart contracts, by sending a message to the zero address. The creation message contains deployment code (initialization code) and the code of the smart contract as EVM bytecode. Ethereum has miners/validators, that include transactions into blocks. That includes executing called smart contracts. To deal with the undecidability of the halting problem, executing EVM instructions costs money, that must be prepaid for in ETH, in the form of gas fees. It also incentivizes miners/validators to include transactions, by rewarding them with the variable part of the gas fee. It can be argued that Ethereum smart contracts are not actually Turing complete, as claimed in the abstract, because of the gas limit. The gas limit is the maximum amount of gas, that can be used in one transaction. However, since the creation of Ethereum the gas limit was raised multiple times and there are ways of splitting execution into multiple transactions.
Transactions and Calls
Transactions are initiated by externally owned addresses. Such a
transaction may contain an external call to a smart contract. Smart
contracts in turn may do internal calls in the same smart contract or do
external calls to others. EVM bytecode implement the concept of
functions. Instead, the standard defines, that the first byte of every
external call must contain the first four bytes of the function
signature’s hash. The function signatures hash is defined as the
keccak256-hash of the name of the function with the types of the
arguments. For example
keccak256("transfer(address,unit256)")[:4]. The Solidity
compiler then typically produces a jump table, mapping the hashes to
offsets in the program.
Ethereum Requests for Comments (ERCs)
“Ethereum Improvement Proposals (EIPs) describe standards for the Ethereum platform, including core protocol specifications, client APIs, and contract standards” (“Ethereum Improvement Proposals,” n.d.). There are multiple types of EIPs. Of interest for us are the ERCs, they define “application-level standards and conventions, including contract standards” (“Ethereum Improvement Proposals,” n.d.). Furthermore, we only consider final ERCs.
Related Work
To quantify the usage of smart contracts, different methodologies can be developed and applied. An alternate approach, to analyzing blockchain data to quantify usage, is to do a social media analysis, and find the smart contract projects that are talked about frequently. An GitHub user under the name of silver84 documented their process of generating weighted graphs, that show the interaction and importance of Ethereum smart contract projects based on follows and likes on Twitter (“Visualisation of the Ethereum Ecosystem: Interactions and Relationships Between Subcommunities,” n.d.). Social media attention does not reflect the actual usage of a project, and can be artificially generated, for example by giveaways, that require following and retweeting, as it is common for NFT projects. Another approach is to do a systematic literature review. Jaoude et al. (Abou Jaoude and Saade 2019) and Leka et al. (Leka, Selimi, and Lamani 2019) both do systematic literature reviews aimed at identifying current applications of smart contracts. However, for identifying the real usage and especially for quantification, academic literature is not the best source of data. Many trends on the Ethereum blockchain are not described in academic literature, and more commonly in blogs or social media, or even not at all, because the creators have no interest in accurately explaining them. Academic literature tends to focus more on underlying technologies, than on applications. Furthermore, the results of literature reviews strongly depend on the selection criteria. (Abou Jaoude and Saade 2019) quantify the most popular application categories, discussed in academic literature. They find IoT, Energy and Healthcare to be the most popular blockchain applications. In this work, we did not find any smart contracts related to any of these three categories, showing that real world usage, at least on Ethereum, differs from what is discussed in academic literature. (Leka, Selimi, and Lamani 2019) do not do a quantification of the application categories.
This work mainly reproduces and expands the work of Angelo and Salzer (2020) (Angelo and Salzer 2020; Di Angelo and Salzer 2019), who categorized smart contracts and their behavior over time. Due to the longer study period, we are able to include events like the “NFT-Hype” and the London hard fork in the analyzed data. Additionally, ERC adoption is analyzed in this work. We consider all smart contacts (wherever tractable), some papers however quantify the usage of smart contracts by only considering contracts with source code available (Bartoletti and Pompianu 2017; Ren et al. 2021). While it is easier to find out the purpose of a smart contract with source code, this introduces the bias, that only smart contracts are considered, where there is an interest in revealing their purpose. In 2020 only 0.4% of deployed smart contracts had source code available (Angelo and Salzer 2020). Kiffer et al. (Kiffer, Levin, and Mislove 2018) look at who creates smart contracts and cluster their bytecode, however they do not associate labels to the clusters. Other work focuses more on the interaction between smart contracts, but do not classify the applications and usage (Chen et al. 2020; Fröwis and Böhme 2017).
Data Collection
The basis of blockchain analysis is data collection and representation. The goal is to have a database, that contain all smart contracts, with bytecode and be able to associate them to transactions. The database should also be fast to query with SQL-style queries. The Ethereum blockchain state is kept by the participating nodes in the network. Nodes are designed to verify new transactions fast, and not for exporting and analyzing data. For example, there is no index of all deployed smart contracts, as it is not needed for standard operation of an Ethereum node. Not only going through all transactions ever created and filtering for transactions to the zero address is sufficient, because the call can occur later in the execution of another transaction hidden deep in the code. Therefore, to get all smart contracts, it is necessary to sequentially re-execute all EVM bytecode ever executed on the blockchain.
There are three types of nodes, classified based on what they store, not all node types are equally suited for blockchain analysis. On the one end there are light nodes, that are very memory efficient, with less than 0.5 , as they only store block headers. However, they are dependent on a supporting full node and take more time for some operations, because the relevant data needs to be fetched from a remote node. Full nodes store the genesis state and the current state, which amounts to 1 of required SSD space. This is enough for independently computing all historic states, but takes a lot of time. Therefore, archive nodes exist that store all states explicitly. To run an archive node, at least 12 of SSD space is required. A common approach for blockchain analysis is to modify the code of an existing client, to export initially relevant data during the sync of a full node or archive node into a (relational) database (Angelo and Salzer 2020; Fröwis and Böhme 2017; Kiffer, Levin, and Mislove 2018). While this approach was very tractable in 2017, it becomes harder over time, because the chain grows, as shown in 1. Due to the rising hardware requirements, newer papers rely on existing datasets and extract specific subsets, that is also what is done in this work.
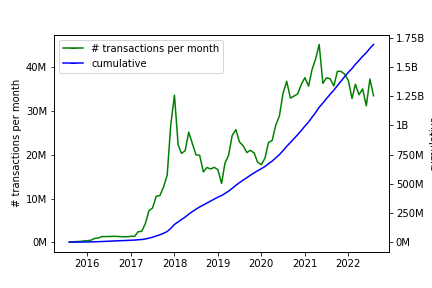
Such datasets are provided by Google in their big query service (Day and Medvedev
2019), dune.com and flipsidecrypto.com.
A downside all the services have, is that the meaning of data fields is
largely undocumented and a significant amount of validating guesses, is
required to use the data in a scientific analysis. Maybe to limit costs,
to limit the amount of data that need to be processed afterwards, or
because of other requirements in the analysis, some works consider only
a subset of smart contracts, like contracts that have at least one
interaction, contracts with source code available, contracts that are
directly created via a transaction or contracts created in a given time
period (Ren
et al. 2021; Yashavant, Kumar, and Karkare 2022; Bartoletti and Pompianu
2017). On the one hand these limitations are sometimes necessary
to make analysis tractable, on the other hand the variety of different
criteria, makes comparison hard. In this work we try, wherever
tractable, and not otherwise stated, to use all smart contracts. To do
this in this work, the smart contracts from the Google big query dataset
are extracted and reorganized in a local SQL database, with the
difference, that we split up the table to be in third normal form. Where
direct access to execution traces is required, dune.com is
used. Smart contracts on the Ethereum main chain until 30. August 2022
are considered.
Most popular Smart Contracts
Different metrics can be used to rate popularity. We look at three of them: most deployed bytecode, most calls and most gas used. For each metric, we calculate the 25 most popular smart contracts and categorize them.
Most deployed
We consider contracts to be equal, if their bytecode is equal.
Deployment code is not considered. As described in 4, to collect all smart
contracts, execution traces need to be analyzed. It must be considered,
that the EVM has a SELFDESTRUCT opcode, that allows for a
contract to be removed from the chain state. Furthermore, a smart
contract can be destructed and re-initialized multiple times, in one
transaction, because its address does not change in one transaction.
There are contracts that make heavy use of this, e.g., the smart
contract with the address
0xbA4Ac7AaDFa00003a20C954e077d5C81994c8ECe was
(re-)initialized 84 times. We have to make sure to correctly handle them
and only consider currently deployed smart contracts.
After extracting the bytecode of the most deployed smart contracts, they were reverse engineered, to categorize them. If no source code is available on etherscan (“Etherscan,” n.d.) or swarmsource (“Swarmsource,” n.d.), which is the majority of cases, the bytecode is reverse engineered by disassembling and decompiling. In comparison to java bytecode decompiling, Solidity is more lossy. Because of code reuse, trying to map decompiled functions to other public code on GitHub using sourcegraph is helpful. As an orthogonal approach, we also look at the behavior of external calls of sampled addresses with that bytecode on etherscan. Interactions with other smart contracts and externally owned contracts help us with the categorization of smart contracts.
The most deployed contracts are the Chi Gastoken, a multi-sig wallet and a proxy. shows the categorization as a stacked bar chart.
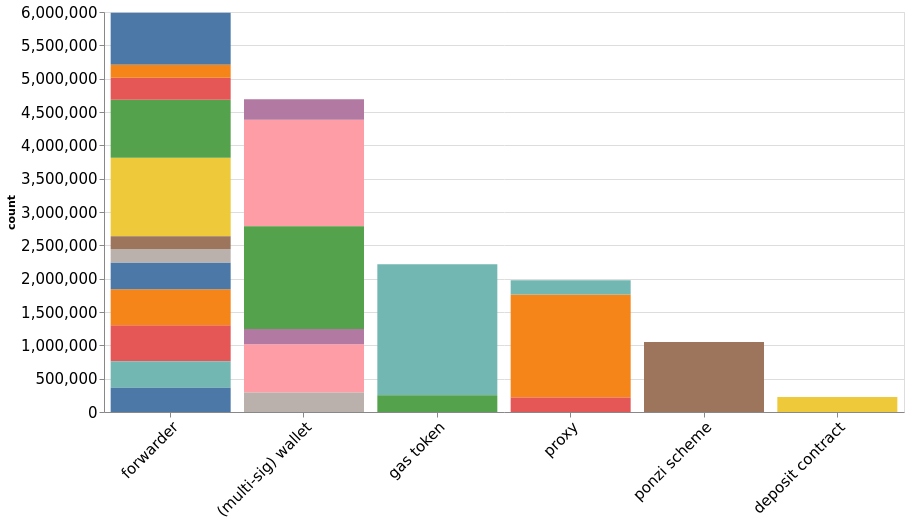
The most prominent category are forwarders, mostly used by exchanges.
Gas tokens
Surprisingly, gas tokens are still among the most deployed contracts, even though they are currently useless. Originally, the EVM would refund gas fees for storing data, when that data got freed again. Especially, storage gets freed when a smart contract is destroyed. This mechanism was designed as an inventive to reduce the state, that nodes have to store. However, it got “exploited”, by gas tokens that were deployed when gas was cheap, and freed, when gas is more expensive. This allowed speculation on and hedging of the gas price. Gas tokens are against the original aim of the incentive, because of their frequent use, they take up a lot of state. Therefore, gas refunds were removed in the London hard fork in August 2021. Today, many gas tokens still exist on the blockchain, as shown in 2. To investigate this further, 3 shows the number of minted and freed gas tokens before and after the announcement and adoption of EIP-3298: Removal of refunds.
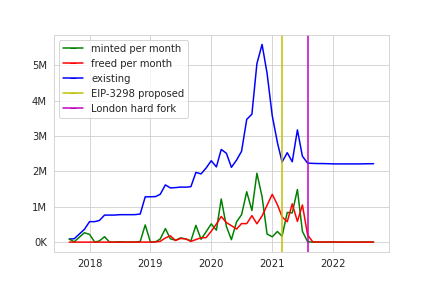
Even though shortly after the hard fork, mints went down, mostly to below 1000 per month, many existing gas tokens did not get freed. Between announcement and adaption, the number of gas token stayed almost the same. This might be because of insufficient communication to the community, users who lost their private key, or smart contracts that were hard-wired to hold gas tokens, with the assumption that they will exist forever.
Contract Lifetime
Di Angelo and Salzer (Di Angelo and Salzer 2019)
characterize smart contracts by their lifetime. Especially they define
mayflies, which are contracts, that SELFDESTRUCT in the
same transaction. Other than that, there are medium lived contracts,
that SELFDESTRUCT at some later time and long-lived
contract, that have not yet executed SELFDESTRUCT.
Particularly after the adoption of EIP-3298 this is interesting to
reproduce with newer data. shows how many contracts were created in each
month of each category.
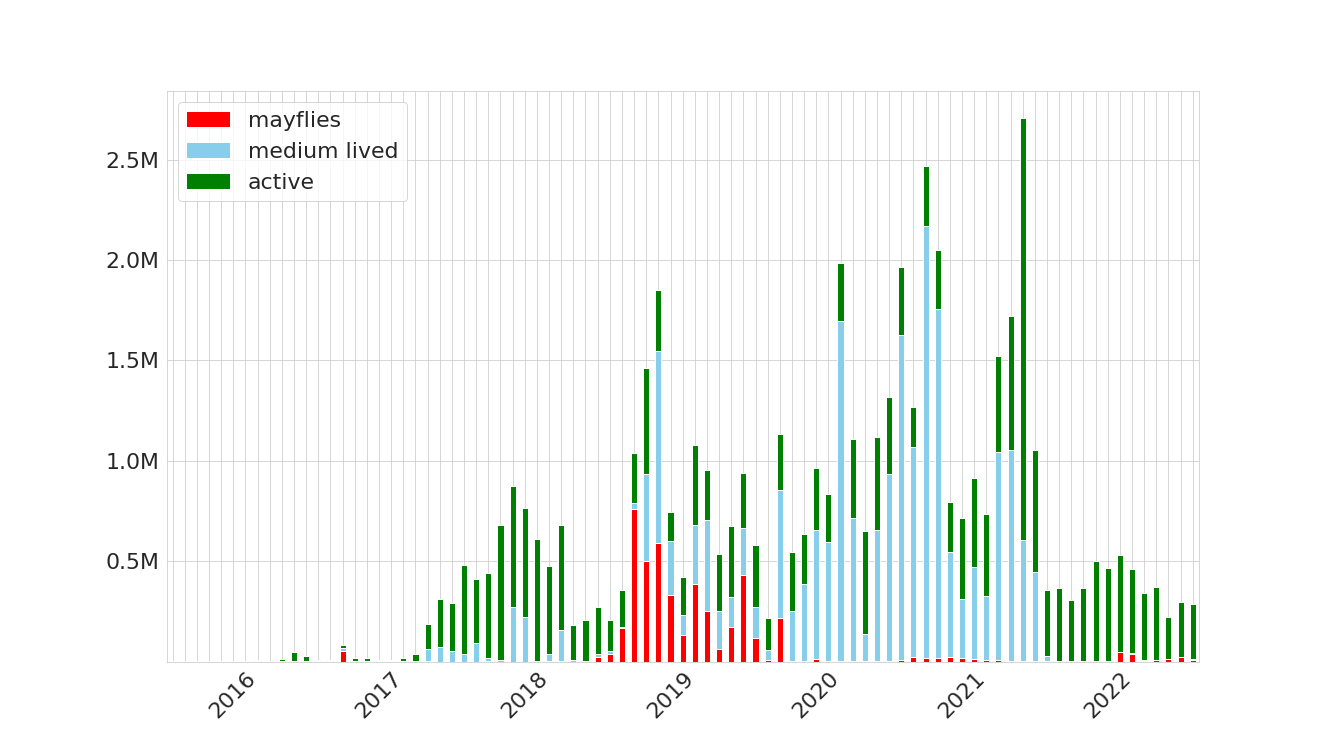
After the incentive went away, users stopped cleaning up state, however most of the previous cleanup were freed gas tokens.
Gas Usage and Number of Calls
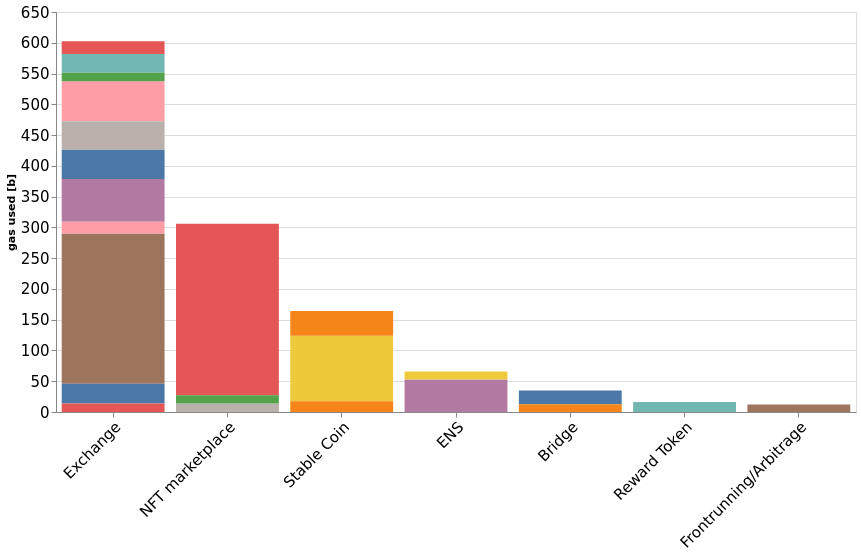
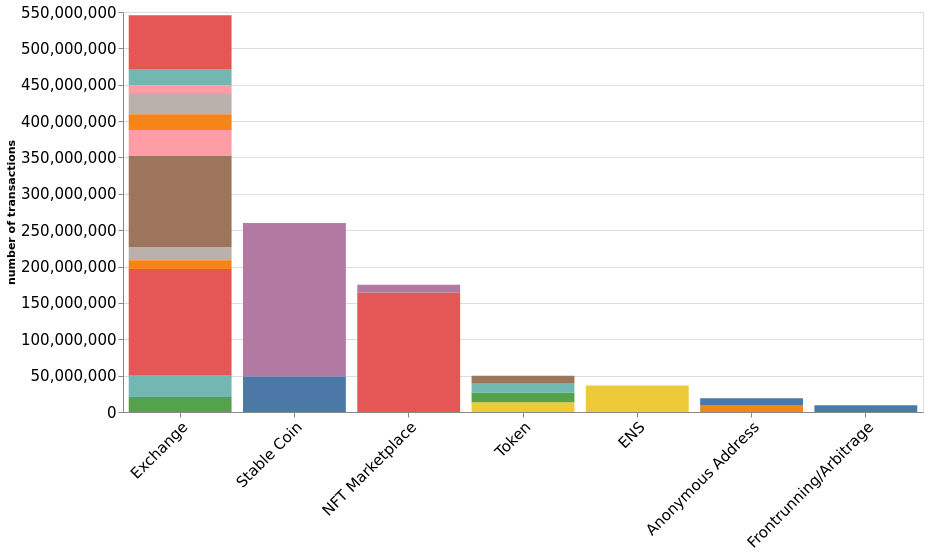
Looking only at most deployed smart contracts, only yields a partial picture of the usage. As smart contracts can be called by every participant in the network, in many cases there is no need to deploy a contract multiple times. Therefore, we also look at gas usage and number of calls, as example metrics to quantify usage. This is however computationally intensive to calculate, we therefore only consider the last 30 days, with a higher computation budget this would be possible to do for the whole time period. Similar results are obtained for both metrics, as shown in 5 and 6, we can see that most of the popular smart contracts are trading related. Bridges are only present among the most popular contracts, when looking at gas usage. They allow for the transfer of assets between chains, or more generally allow constituting or redeeming off-chain claims. Bridges commonly work by rolling up zero knowledge proofs. Compared to the oftentimes rather simple operations performed by other smart contracts, this is a gas intensive computation.
This paragraph is based on the observation a Twitter user pointed out (“Looks Rare Comparison,” n.d.), similar results are published in (Serneels 2022). It should serve as an example for why certain metrics of popularity can be misleading, and quantifying popularity required looking at multiple metrics. To compare the popularity of marketplaces, typically their trading volume is compared. OpenSea was long the NFT marketplace with the highest trading volume (per week), but was surpassed temporarily by LooksRare. A first sign that the trading activity on LooksRare is made up differently, is that in January only 14K addresses ever traded on LooksRare versus 247K on OpenSea. Further suspicious is, that the LooksRare trading volume is, still to this day, spiking in very small time windows. On the scale of individual NFT collections, this effect is even more visible. The left graph in [fig:wash] shows this pattern, at the example of the Meebits collection.

The trading pattern on Open Sea looks a lot more regular. Interesting is, that filtering out back and forth trades between two wallets gets rid of many high price trades in a short window of time. Additionally, filtering trades that are above the highest price recorded on OpenSea and filtering out trades, if the same NFT was traded more than three times per day, gets rid of almost all suspicious looking patterns in the in [fig:wash] (left), and makes the data look similar (although more sparse) to the OpenSea data. The rationale of this is filtering out so-called wash trades, even though the rules are not perfect. Wash trades are defined as one investor selling and buying the same item at the same time. Wash trades are used to inflate the price of an item before selling it to another party, who is under the impression, that the previously paid prices are market prices. Wash trading is illegal in most markets and jurisdictions. Until now (3. October 2022), LooksRare has a total trading volume of 26 746 538 778 USD. Applying these filters to all trades, reduces the trading volume to 1 445 375 608 USD. The reason why wash trades are particularly common on LooksRare, compared to other exchanges, is that LooksRare incentives trading by paying out a share of the trading volume in their own token called LOOKS (“Looks Rare Comparison,” n.d.; Serneels 2022).
ERC Adoption
Another approach to quantify what smart contracts are doing, in the absence of a universal algorithm to categorize them, is to look at what standards they implement. A majority of ERCs define a set of functions that smart contracts need to have. From the standards, we extract non-optional functions and compute the hashes of the function signature, as described in 2.2. The set of function signatures allow us to define signatures for ERCs. We then check every smart contract, meaning every address, against every signature. ERC 1167 and ERC 3448 are defined by their bytecode structure. They can be matched by a SQL wildcard expression on the hex representation of their bytecode. Here all smart contracts ever deployed (after a transaction) are considered, because, there may be good reasons to destruct a smart contract after a short time of using it.
Perhaps unsurprisingly, the most implemented standards are the Light Contract Ownership (2.6 M deployments) and the Contract Ownership (574K deployments), as they are foundational for many applications. They are followed by the ERC 20 Token (205 K) and the Non-Fungible Tokens (ERC 721) standards, which, in comparison only, has 4 K deployments. After the “NFT hype” in 2020, that number may be suspected to be higher. The number might be low, because there are smart contracts that essentially implement a NFT, but do not respect the standard. However, we suspect these non-conformant NFTs to a small effect, because implementing the standard comes with the benefit of the NFTs being shown on NFT platforms. The effect probably mainly comes from most NFTs not being on the main chain, but on side chains such as Polygon or Arbitrum. The other results for number of ERC implementations are listed in 1.
| # | ERC |
|---|---|
| 2.6M | Light Contract Ownership (ERC 5313) |
| 574K | Contract Ownership Standard (ERC 173) |
| 205K | Token (ERC 20) |
| 4179 | Non-Fungible Token (ERC 721) |
| 1389 | Token Receiver (ERC 1155) |
| 523 | Standard Signature Validation Method (ERC 1271) |
| 172 | Payable Token (ERC 1363) |
| 130 | Standard Interface Detection (ERC 165) |
| 121 | ERC777 Token (ERC 777) |
| 76 | ENS Resolver (ERC 137) |
| 66 | Flash Borrower (ERC 3156) |
| 51 | NFT Royalty Standard (ERC 2981) |
| 50 | Reverse ENS Resolver (ERC 181) |
| 18 | ERC777 Token Sender (ERC 777) |
| 10 | Pseudo-introspection Registry Contract (ERC 820) |
| 3 | ERC1363 Spender (ERC 1363) |
| 0 | Flash Lender (ERC 3156), Token Receiver (ERC 777), Multi Token (ERC 1155), Receiver (ERC 1363), Abstract Storage Bonds (ERC 3475), Semi-Fungible Token (ERC 3525), Slot Approvable (ERC 3525), Slot Enumerable (ERC 3525), Secure Offchain Data Retrieval (ERC 3668), EIP721 Consumable (ERC 4400), Tokenized Vaults (ERC 4626), Rental NFT (ERC 4907), Minimal Proxy Contract (ERC 1167), MetaProxy Standard (ERC 3448) |
Surprisingly, the majority of considered ERC are very rarely implemented or not implemented at all.
Conclusion
We describe methods to analyze smart contracts and their bytecode at scale, that allow most queries described queries to run on all smart contracts. These methods are applied first to quantifying the popularity of smart contracts, according to multiple metrics. Popular smart contracts are mostly used for the trading of tokens. Looking at most deployed smart contracts also revealed, that there are still many gas tokens in use, even though they were made obsolete by the London hard fork. We suspect insufficient communication to users, lost keys and not immutable smart contracts to be contributing factors to this. It still remains an open question on how to effectively incentivize state cleanup, while still keeping persistent storage. We point out that single metrics can be misleading, using the example of NFT wash trading.
Furthermore, we describe a method to identify ERC implementations in EVM bytecode. Applying this method to all smart contracts, we discover that ownership and tokens are the most implemented standards. Surprisingly, many standards for smart contracts and their interfaces are not implemented at all. Future research can be done on why this is the case. Another avenue for future work is to build an ontology of smart contracts, with categories and signatures.